Russian Writers CSV and some graphs
It was always interesting for me how different russian writers relate to each other.
For example, could Dostoyevky meet Gogol at all or not?
We are going to create csv with brief info like years of life for all russian writers.
I did not think too much and just parse appropriate wiki page – thanks to it very much:
import requests
from bs4 import BeautifulSoup

WIKI_RUS_WRITERS_URL = 'https://en.wikipedia.org/wiki/List_of_Russian-language_writers'

soup = BeautifulSoup(requests.get(WIKI_RUS_WRITERS_URL).content, 'lxml')
import re

all_lis = soup.find('div', id='mw-content-text').find_all('li')
lis = [li.text for li in all_lis if re.search(r'> \(', str(li))]

def extract_fields(li):
    name = li.partition('(')[0].strip()

    years = re.search(r'\((.+?\))', li).group(0)
    years = re.findall(r'[0-9]{4}', years)

    birth, death = '', ''
    if len(years) == 1:
        birth = years[0]
    elif len(years) == 2:
        birth, death = years

    descr = li.partition(')')[2]
    descr_parts = re.split(r', (?=[A-Z])', descr)
    descr = descr_parts[0].strip().strip(',.;').strip()

    works = ''
    if len(descr_parts) > 1:
        works = ','.join(descr_parts[1:])

    return name, birth, death, descr, works

lis = [extract_fields(li) for li in lis]
lis = [li for li in lis if not (li[1] == '' and li[2] == '')]

columns = ('name', 'birth_year', 'death_year', 'about', 'works')
separator = ';'

def save_to(s):
    s.write(';'.join(columns))
    s.write('\n')
    for li in lis:
        s.write(';'.join(li))
        s.write('\n')

from io import StringIO
csv = StringIO()
save_to(csv)

# # or local file
# with open('russian-writers.csv', 'w') as f:
#     save_to(f)

print(csv.getvalue()[:1000], '...')
name;birth_year;death_year;about;works
Alexander Ablesimov;1742;1783;opera librettist, poet, dramatist, satirist and journalist;
Fyodor Abramov;1920;1983;novelist and short story writer;Two Winters and Three Summers
Grigory Adamov;1886;1945;science fiction writer;The Mystery of the Two Oceans
Georgy Adamovich;1892;1972;poet, critic, memoirist, tanslator;
Alexander Afanasyev;1826;1871;folklorist who recorded and published over 600 Russian folktales and fairytales;Russian Fairy Tales
Alexander Afanasyev-Chuzhbinsky;1816;1875;poet, writer, ethnographer and translator;
Alexander Afinogenov;1904;1941;playwright;A Far Place
M. Ageyev;1898;1973;pseudonymous writer;Cocain Romance
Chinghiz Aitmatov;1928;2008;;Kyrgyz novelist and short story writer,Jamilya,The Day Lasts More Than a Hundred Years
David Aizman;1869;1922;;Russian-Jewish writer and playwright
Bella Akhmadulina;1937;2010;modern poet;The String
Anna Akhmatova;1889;1966;acmeist poet;Requiem
Ivan Aksakov;1823;1886;journalist, slavophile ...
Russian Writers CSV
The same on github code
import pandas as pd
import plotly.plotly as py
import plotly.graph_objs as go

RUS_WITERS_CSV = 'https://raw.githubusercontent.com/boorstat/boorstat-files/master/lit/russian/russian-writers.csv'
Getting csv as pandas dataframe:
df = pd.DataFrame.from_csv(StringIO(requests.get(RUS_WITERS_CSV).text), index_col=None, sep=';')
If you have data frame – you have a graph :)
At first – prettier looking multi-color Gantt style graph.
Which is much easier to code in addition.
import plotly.figure_factory as FF
import math

FAMOUS_RUS_WRITERS = [
    'Leo Tolstoy',
    'Fyodor Dostoyevsky',
    'Mikhail Bulgakov',
    'Aleksandr Solzhenitsyn',
    'Alexander Pushkin',
    'Ivan Turgenev',
    'Anton Chekhov',
    'Alexander Blok',
    'Ivan Bunin',
    'Marina Tsvetaeva',
    'Nikolai Gogol',
    'Mikhail Lermontov',
    'Maxim Gorky',
    'Boris Pasternak',
    'Vladimir Mayakovsky',
    'Ivan Goncharov',
    'Nikolai Leskov',
    'Mikhail Saltykov-Shchedrin',
    'Sergei Yesenin',
    'Isaak Babel',
    'Andrei Bely',
    'Ivan Krylov',
    'Osip Mandelstam',
    'Mikhail Sholokhov',
    'Anna Akhmatova',
    'Nikolay Nekrasov',
]

df_gantt = df[['name', 'birth_year', 'death_year']].copy()
df_gantt.rename(
    columns={
        'name': 'Task',
        'birth_year': 'Start',
        'death_year': 'Finish'},
    inplace=True)

df_gantt = df_gantt[df_gantt['Task'].map(
    lambda v: any([w in v for w in FAMOUS_RUS_WRITERS]))]

df_gantt_birth = df_gantt.copy()

df_gantt_birth.sort_values(['Start'], inplace=True)

df_gantt_birth.reset_index(inplace=True, drop=True)

df_gantt_birth['Task'] = df_gantt_birth[['Task']].apply(
    lambda v: v[0].split()[-1], axis=1)

df_gantt_birth['Start'] = df_gantt_birth[['Start']].apply(
    lambda v: '{}-12-31'.format(str(int(v[0]))), axis=1)
df_gantt_birth['Finish'] = df_gantt_birth[['Finish']].apply(
    lambda v: '{}-12-31'.format(str(int(v[0]))), axis=1)

fig = FF.create_gantt(
    df_gantt_birth, showgrid_x=True, showgrid_y=True,
    title='Famous Russian Writers Years of Life sotred by Birth')
py.iplot(fig, filename='russian-writers-years-of-life-start-sorted', world_readable=True)
And the same writers list but sorted by length of life:
df_gantt_len = df_gantt.copy()

df_gantt_len['life_len'] = df_gantt_len[['Start', 'Finish']].apply(lambda v: int(v[1] - int(v[0])), axis=1)
df_gantt_len.sort_values(['life_len'], inplace=True)
df_gantt_len.reset_index(inplace=True, drop=True)

df_gantt_len['Task'] = df_gantt_len[['Task', 'life_len']].apply(
    lambda v: '{name}'.format(name=v[0].split()[-1], len=v[1]), axis=1)

df_gantt_len['Start'] = df_gantt_len[['Start']].apply(
    lambda v: '{}-12-31'.format(str(int(v[0]))), axis=1)
df_gantt_len['Finish'] = df_gantt_len[['Finish']].apply(
    lambda v: '{}-12-31'.format(str(int(v[0])) if not math.isnan(v[0]) else '2020'), axis=1)

fig = FF.create_gantt(
    df_gantt_len, showgrid_x=True, showgrid_y=True,
    title='Famous Russian Writers Years of Life sorted by Length of Life')
py.iplot(fig, filename='russian-writers-years-of-life-len-sorted', world_readable=True)
You can see the “EDIT CHART” button at the bottom on graphs.
It’s interesting button – thanks to Plotly very much.
Click it and Online Graph Maker opens.
But seems like it’s not possible to get filterable by writers data grid in that Online Maker with current create_gantt() implementation.
That’s why we are going to create the next graph.
Which is more complicate a little bit but it has out of the box ability to be filtered through Plotly Online Graph Maker.
df_bars = df.copy()
df_bars['birth_year'] = df_bars[['birth_year']].apply(
    lambda v: int(v[0]), axis=1)
df_bars['death_year'] = df_bars[['death_year']].apply(
    lambda v: int(v[0]) if not math.isnan(v[0]) else 2020, axis=1)

df_bars['life_len'] = df_bars[['birth_year', 'death_year']].apply(
    lambda v: v[1] - v[0], axis=1)

offsets = go.Bar(
    y=df_bars['name'],
    x=df_bars['birth_year'],
    name='birth',
    orientation = 'h',
    opacity=0
)
lifes = go.Bar(
    y=df_bars['name'],
    x=df_bars['life_len'],
    name='life len',
    orientation = 'h',
    hoverinfo=df_bars[['name', 'death_year']].apply(
        lambda v: '{name} ({year})'.format(name=v[0], year=v[1]), axis=1)
)

data = [offsets, lifes]
layout = go.Layout(
    barmode='stack',
    showlegend=False,
    margin={'l': 200},
    xaxis={
        'autorange': False,
        'range': [1650, 2020]}

)

fig = go.Figure(data=data, layout=layout)
py.iplot(fig, filename='russian-writers-life-bars')
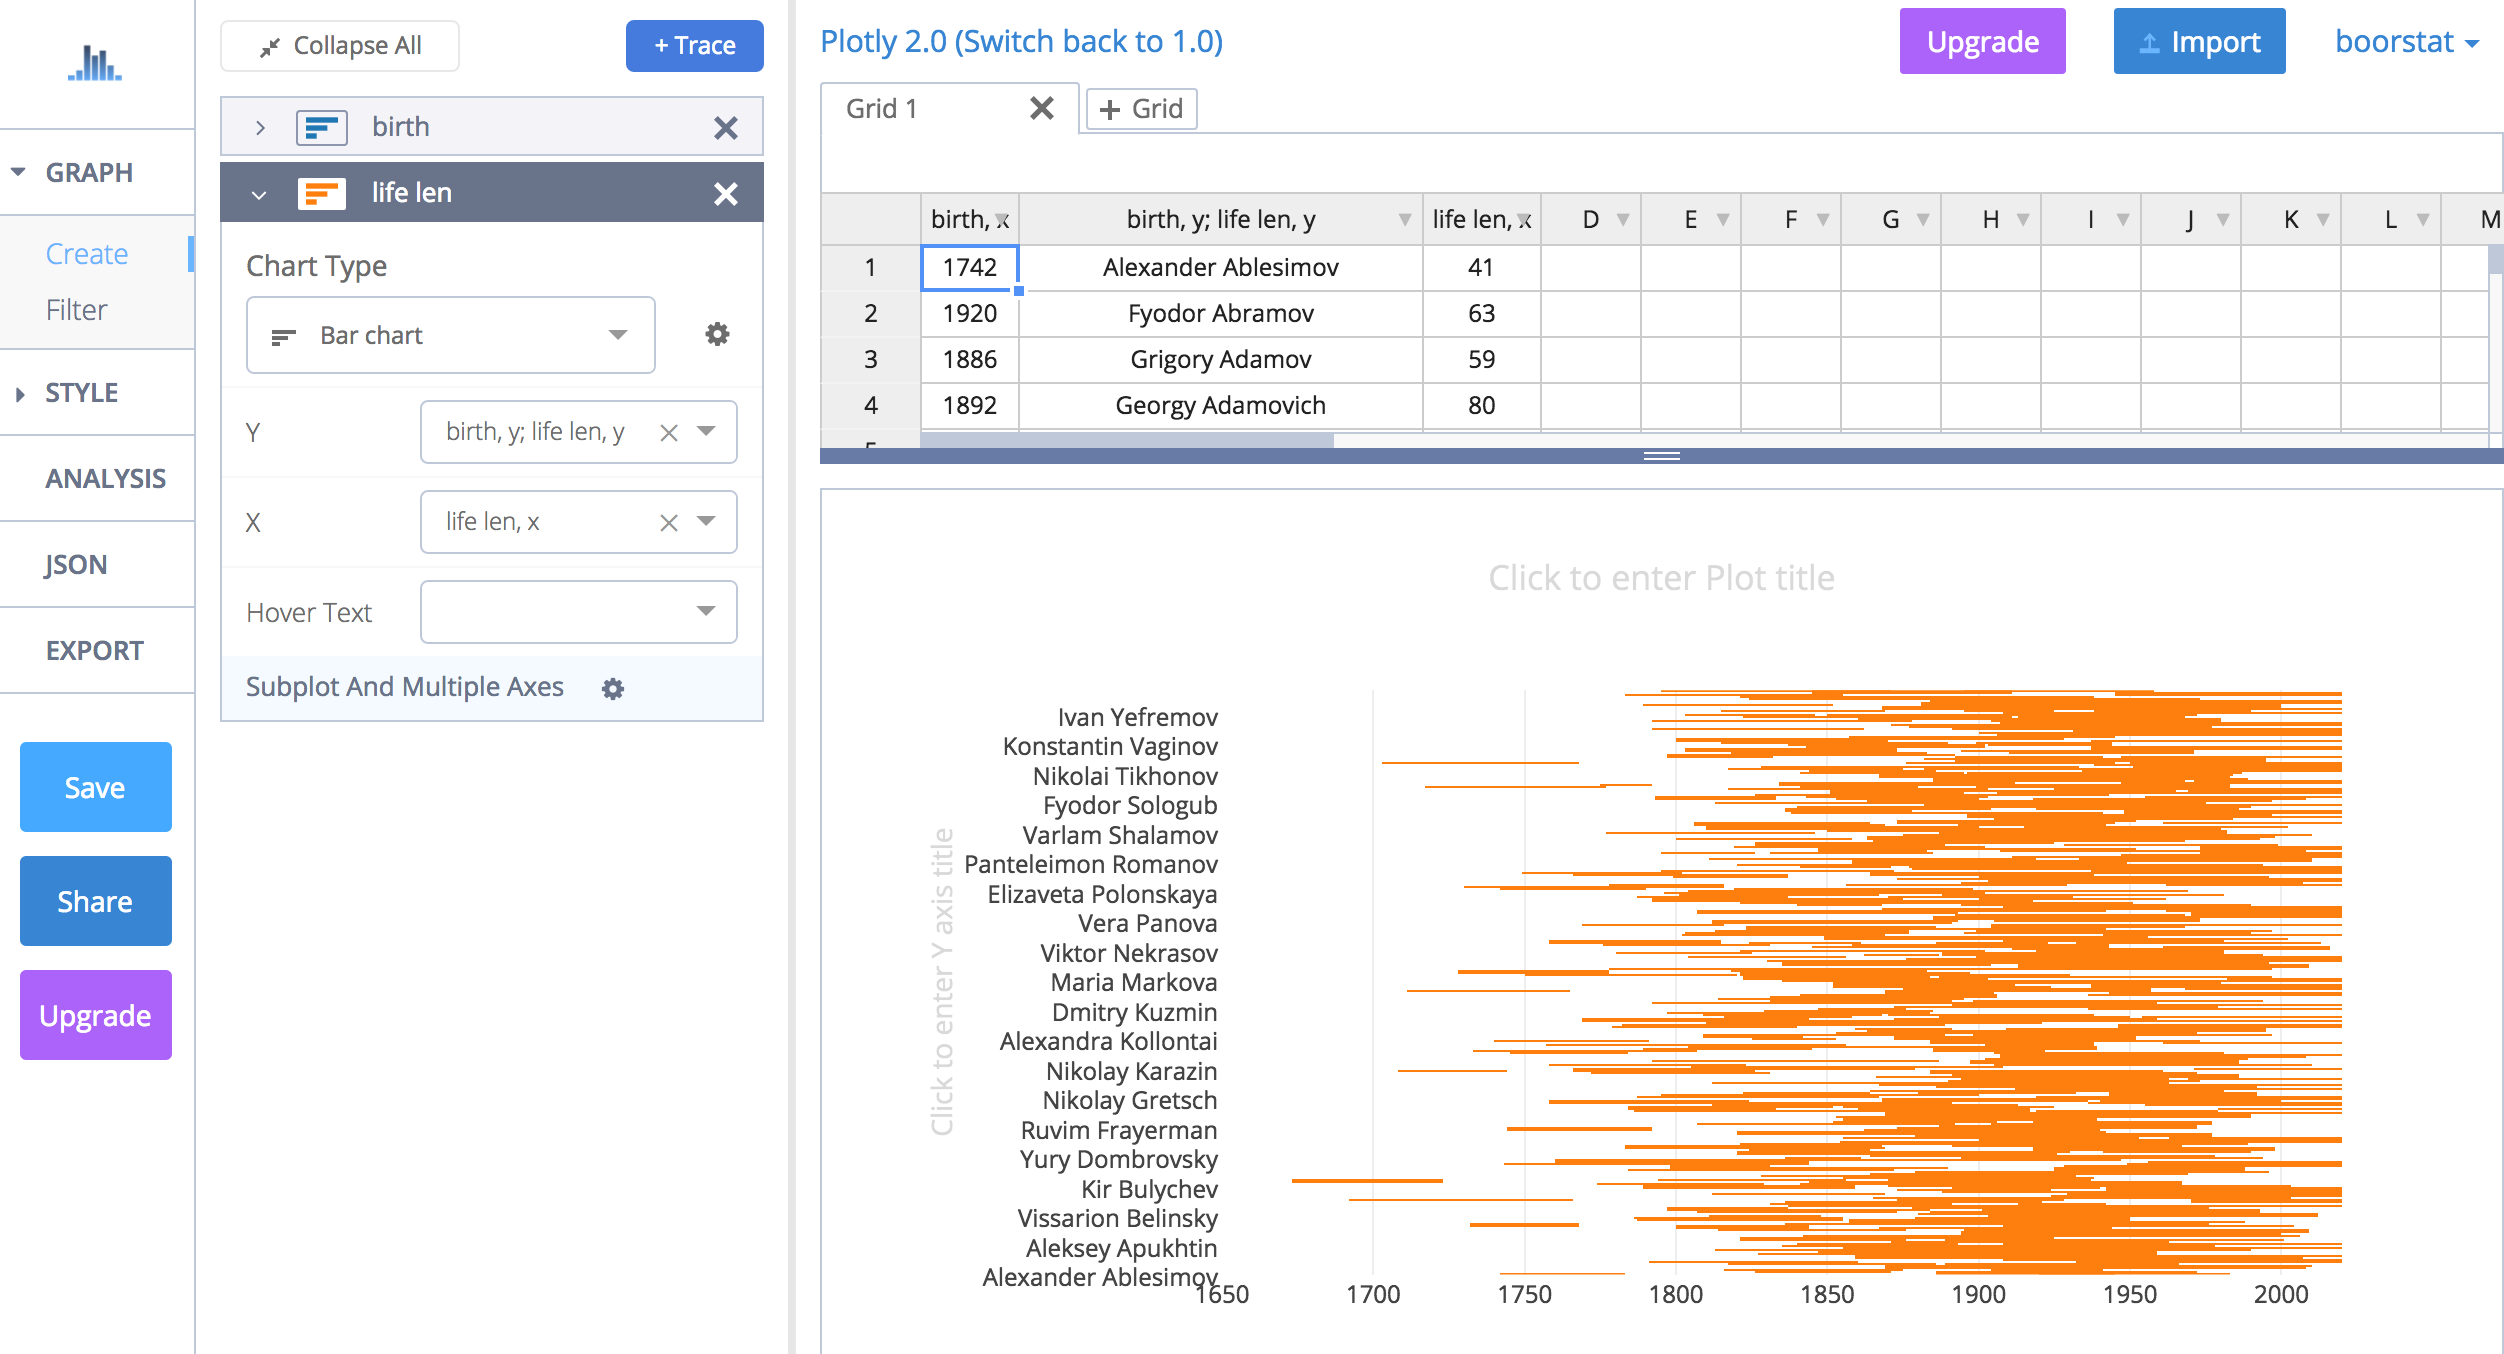
Click “EDIT CHART” at the bottom of graph.
You should see something like this after nearly 10 secs of loading:
Select Filter in menu and click “+ Filter” button.
You can fill fields in that manner:
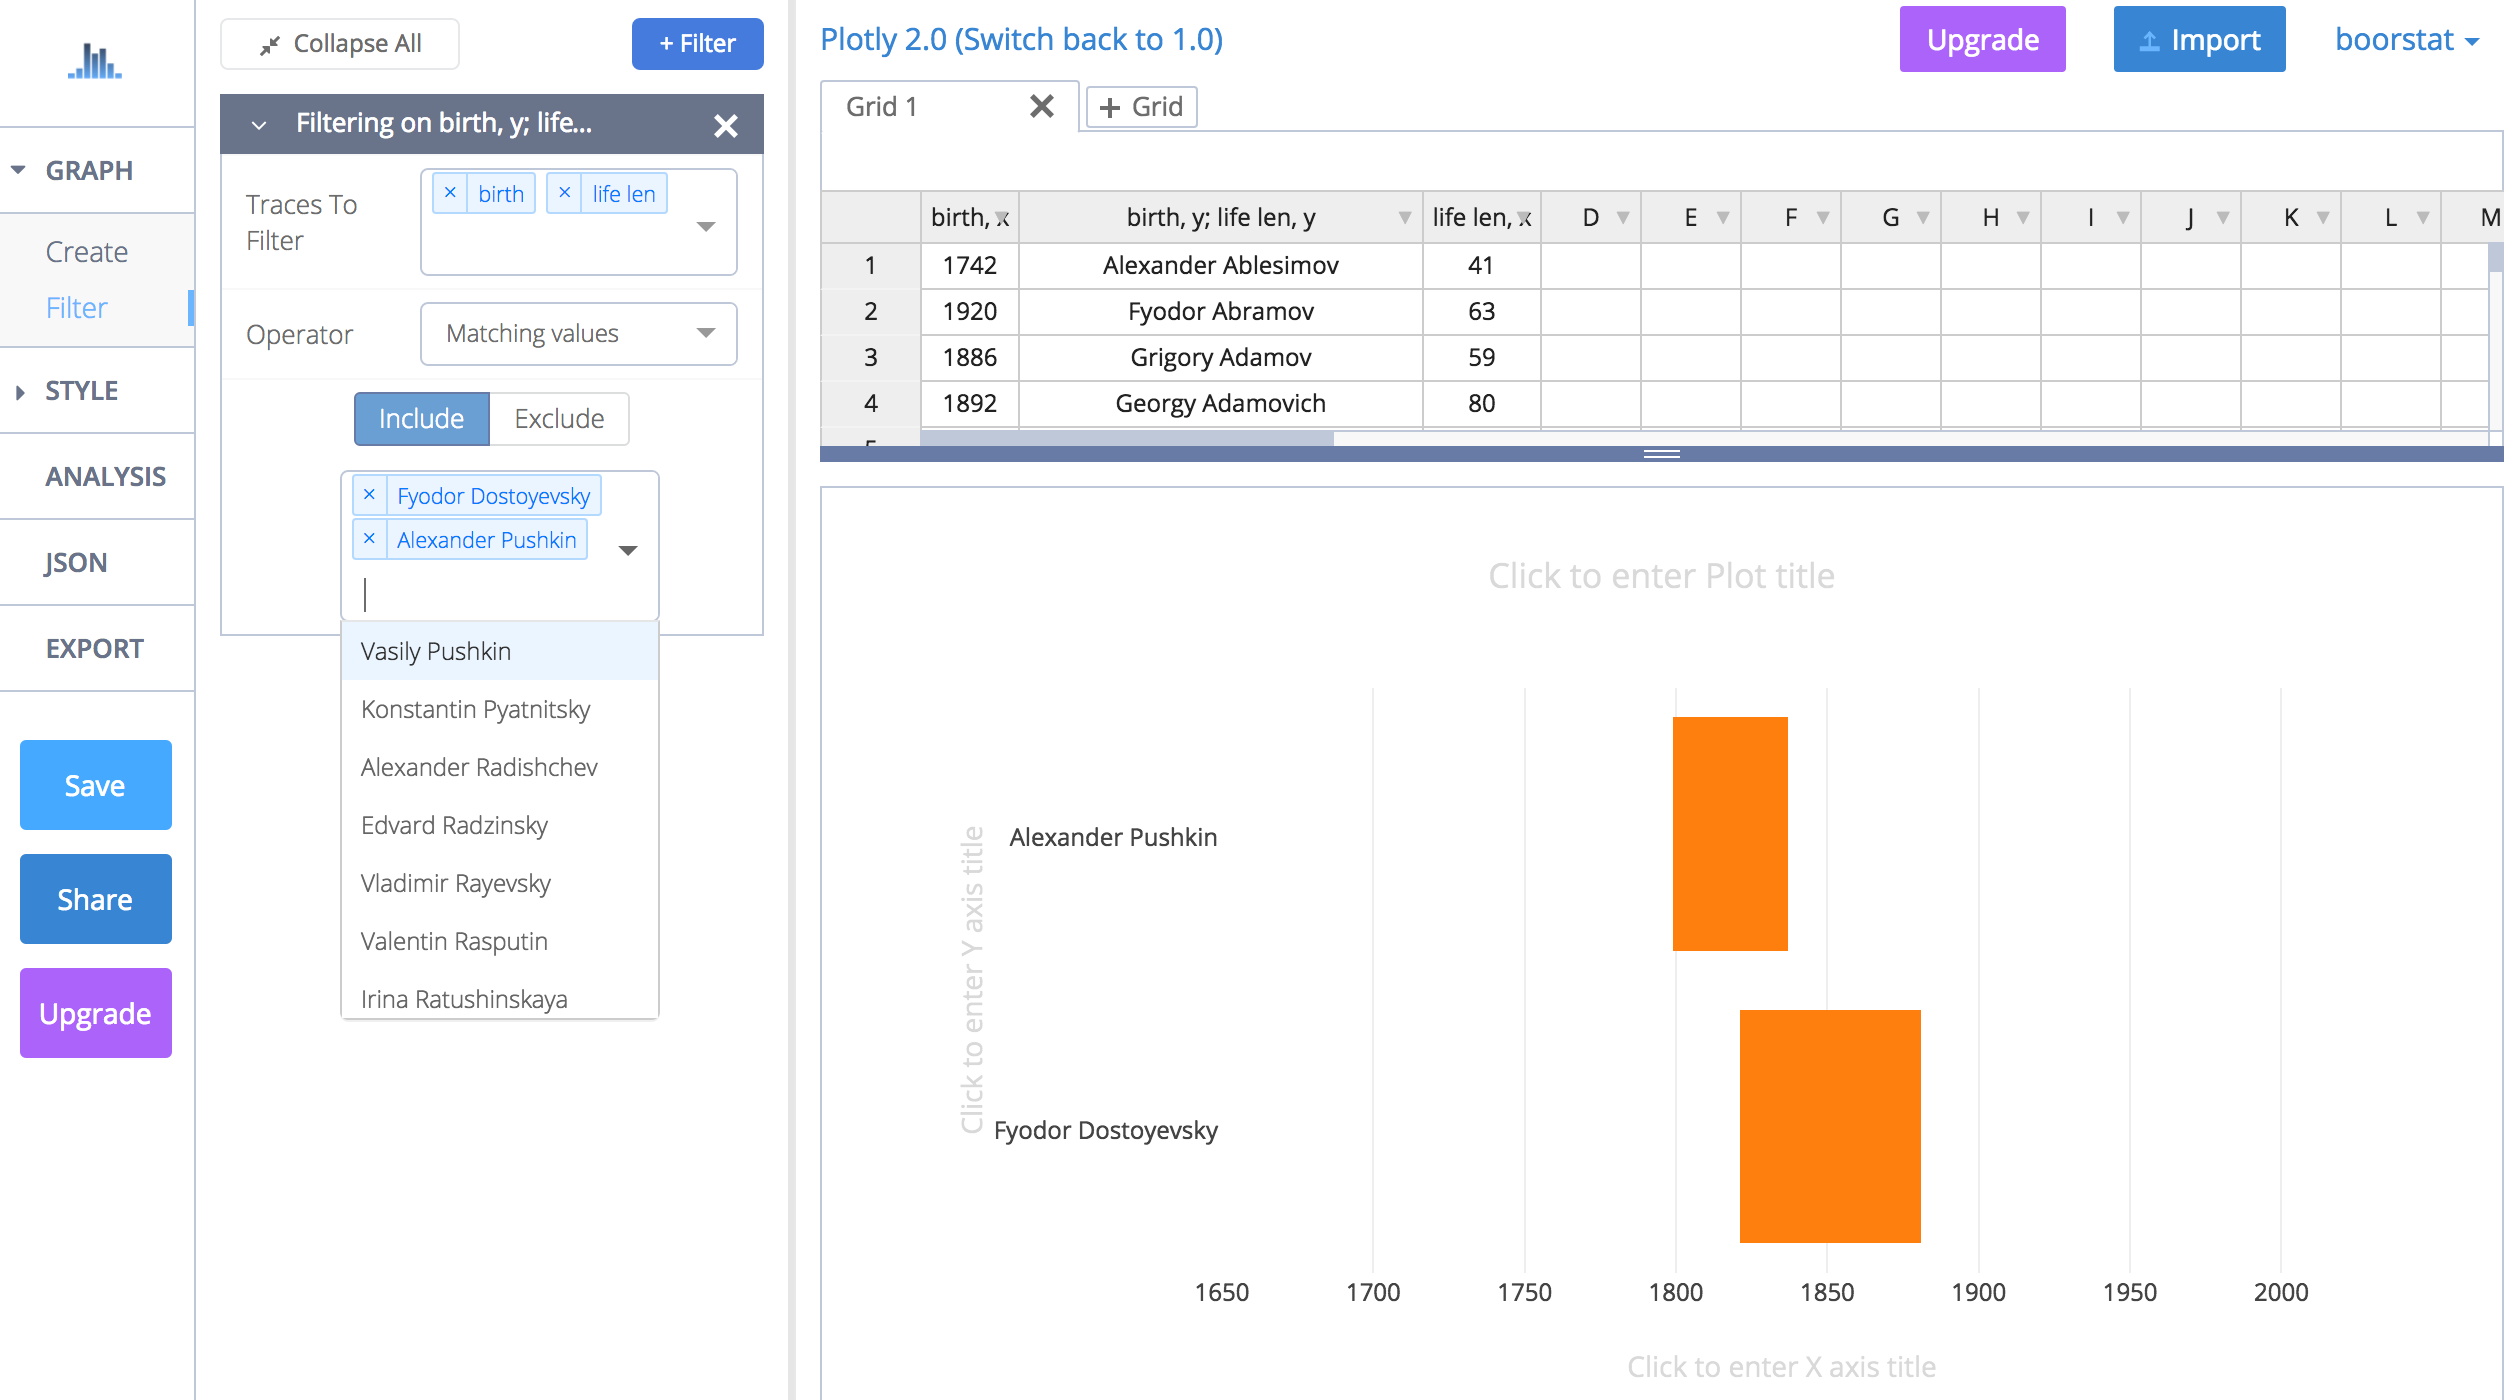
Try to experiment with writers list on graph.
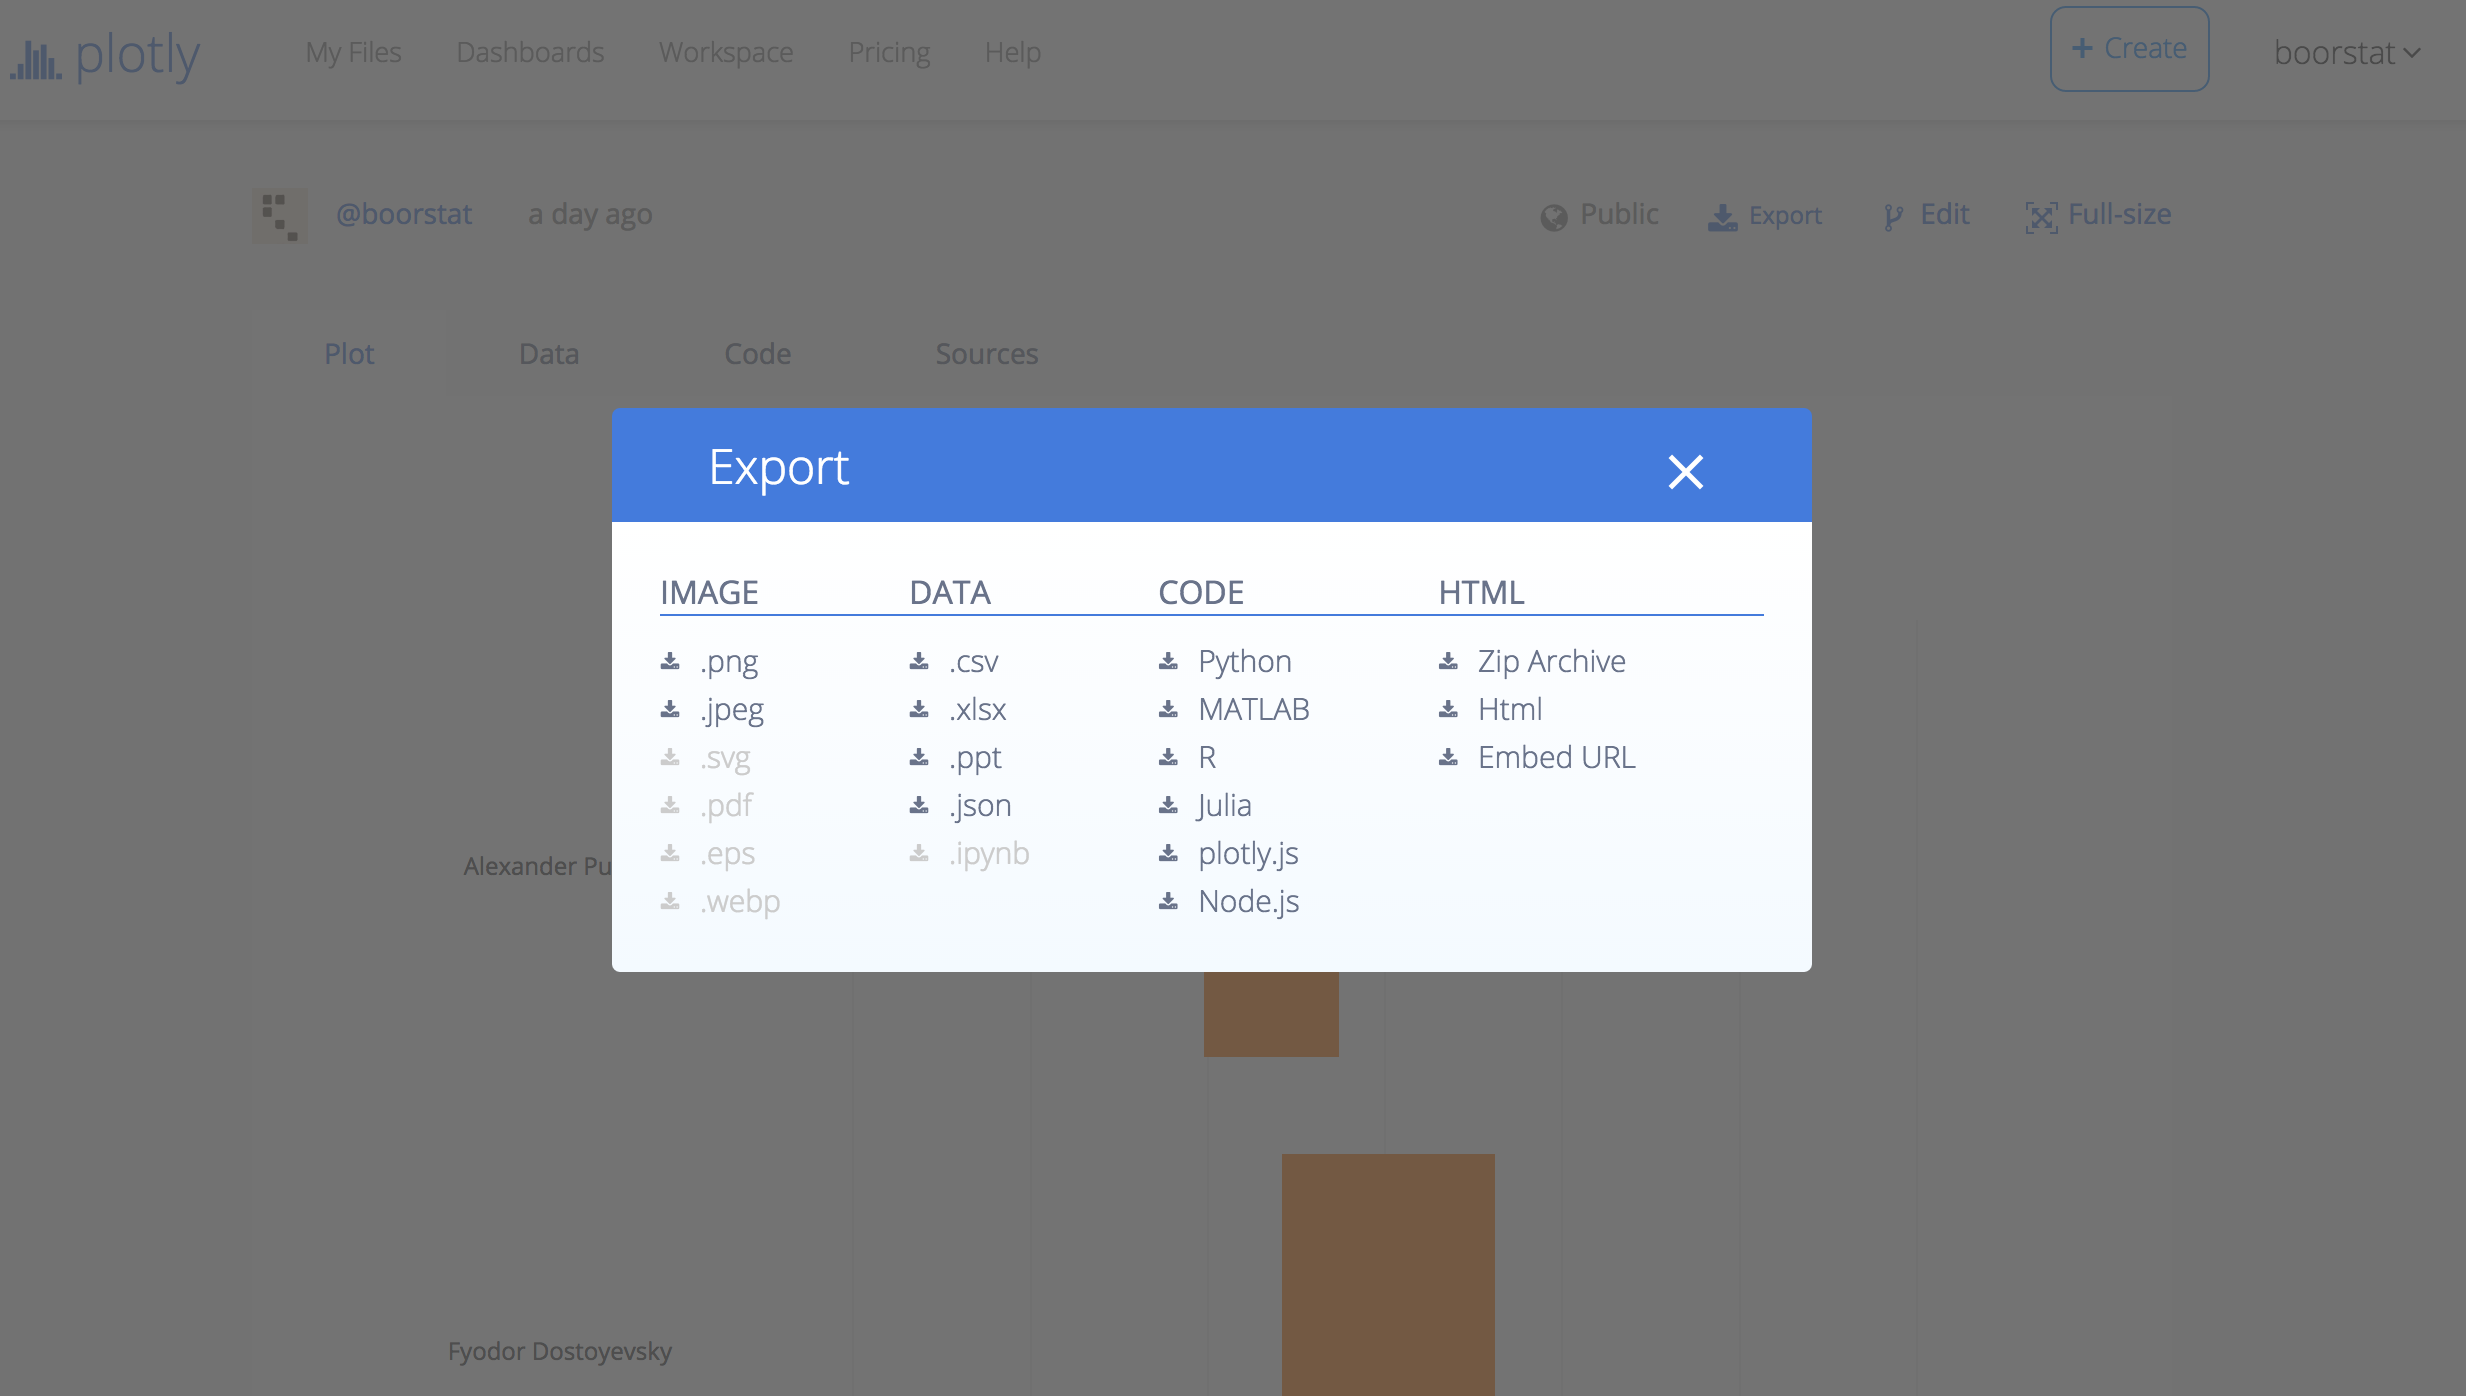
Then you can export the result to image formats, data like json, code (python, node.js and others) or even html.
But registration in Plot.ly is needed to get these features work.
After logged in let’s return to Graph Maker and click “Save” button.
Then you can find saved graph in Your Files and any of them you can export to needed format.
Hope you enjoyed!